AI-Powered Solar Panel Defect Detection
Replaced subjective manual grading of electroluminescence images with a computer-vision model that classifies module defects in 1.8 seconds at 99.1% recall. 2M+ images inspected per year, with missed-defect escapes down 87%.
The Challenge
Every solar module a client manufactures gets photographed under electroluminescence, an X-ray-like image that reveals micro-cracks, dead cells, and soldering faults invisible to the eye. Inspectors graded these images by hand, one at a time, squinting at grayscale wafers on a laptop in a noisy factory. It was slow, it didn't scale past a few hundred modules a shift, and worst of all it was subjective: two inspectors would grade the same panel differently, and tired eyes at hour seven missed the hairline cracks that turn into field failures years later. Defects were escaping to the field, and the firm was carrying the liability.
The Impact
Defect grading went from a manual minute-per-module bottleneck to 1.8 seconds of automated inference, letting a single inspection station clear an entire production shift's output. The model catches 99.1% of true defects, well past human consistency, and missed-defect escapes to the field dropped 87% in the first year. Inspectors stopped grading and started adjudicating only the handful of borderline cases the model flagged for review. Across the client's factories the system now inspects over 2 million EL images a year, and for the first time quality directors can watch defect rates per production line in real time instead of discovering a bad batch after it shipped.
What We Built
A computer-vision system that looks at every EL image the moment it's captured and finds the defects automatically: micro-cracks, finger interruptions, dead and inactive cells, PID degradation, and soldering faults, then grades each module's severity against IEC standards. It runs on a small box right on the factory floor so inspectors get a verdict in under two seconds without an internet connection, and every result syncs to the cloud where quality directors see defect trends across the whole production line. No two-inspector disagreement. No fatigue. Nothing slips through at hour seven that wouldn't slip through at hour one.
Technical Diagrams
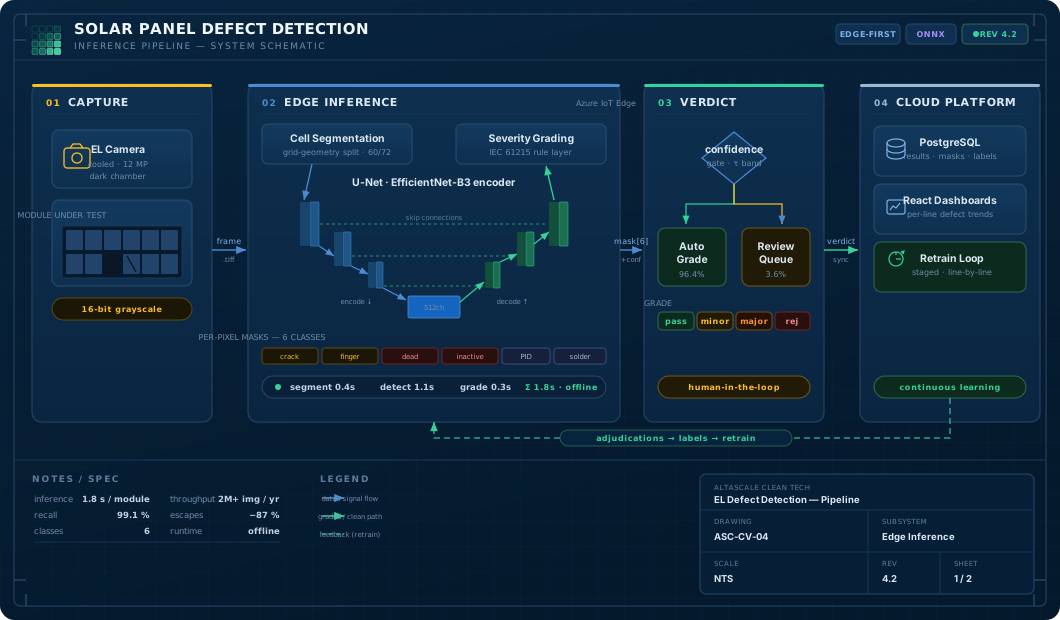
Offline inference on the line
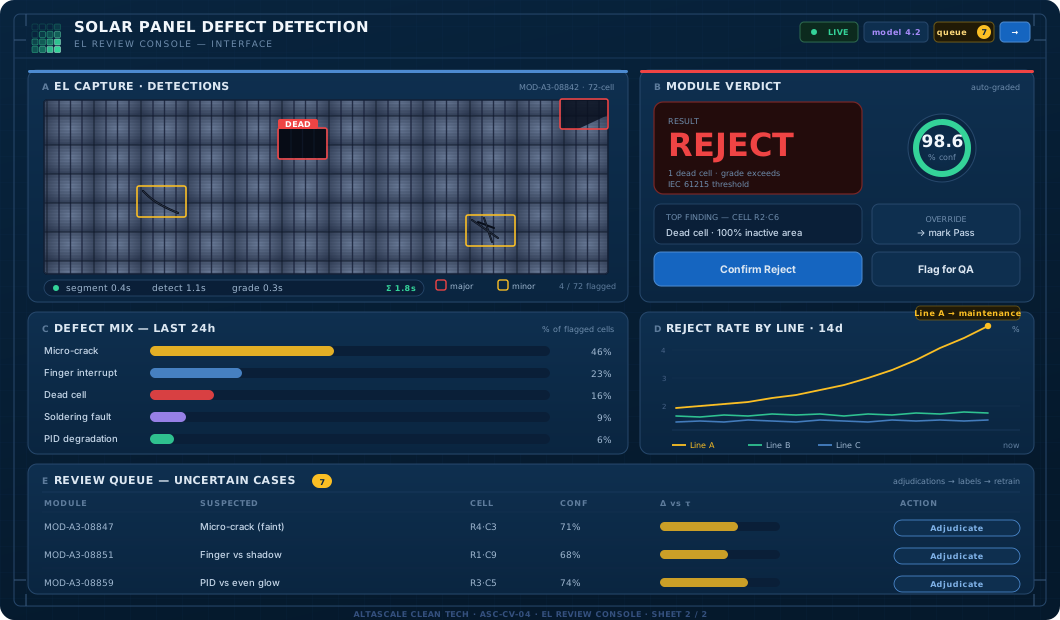
Inspector review screen (illustrative)
Background
The client runs factory-floor quality inspections for solar module manufacturers across Asia and Europe. A core part of every audit is electroluminescence (EL) imaging: a current is passed through a finished module in a dark chamber, and a cooled camera captures the infrared glow. Healthy silicon glows evenly; cracks, broken interconnects, and dead cells show up as dark lines and patches. EL is the single most revealing test in module QA: it surfaces damage that no visual or flash test can see.
The problem was grading. Each EL image was reviewed by hand: an inspector opened the grayscale capture on a laptop, zoomed around the 60 or 72 cells looking for defects, classified what they found, and assigned a pass/fail severity. A skilled inspector took roughly a minute per module. On a high-volume line producing thousands of modules a day, that was a hard ceiling: they could only sample a fraction of production, and the samples they did grade were inconsistent.
Two issues made the manual process untenable. First, subjectivity: inter-inspector agreement on borderline micro-cracks was poor, and the same inspector graded differently at the start and end of a shift. Second, escapes: hairline cracks and partially inactive cells that are easy to miss are exactly the defects that propagate into power loss and warranty claims years later. The firm was certifying modules that failed in the field, and carrying the reputational and contractual liability for it.
Technical Approach
Annotation and Dataset
A defect model is only as good as its labels. We started by building a tightly controlled annotation pipeline. Senior inspectors labeled a seed set of EL images using a custom tool that enforced a fixed taxonomy: micro-crack, finger interruption, dead cell, inactive area, PID (potential-induced degradation), soldering fault, with pixel-level masks rather than bounding boxes, since defect severity depends on the area of inactive silicon, not just its presence.
To handle disagreement on borderline cases, every image in the calibration set was labeled independently by three inspectors, and we used the consensus as ground truth while tracking the disagreement rate as a benchmark the model would later have to beat. Aggressive augmentation (rotation, brightness and contrast jitter, simulated busbar occlusion, and synthetic crack injection) expanded the effective dataset and made the model robust to the lighting and camera variation found across different factory chambers.
Model Architecture
The core is a segmentation model, a U-Net with an EfficientNet encoder, that produces a per-pixel defect mask for each of the six classes. We chose segmentation over plain classification deliberately: it lets the system measure the fraction of inactive cell area, which is what actually drives the IEC-aligned severity grade, and it makes every verdict explainable. An inspector reviewing a result sees exactly which pixels the model flagged and why.
Key decisions:
- Cell-level decomposition: each module image is first segmented into its individual cells using the busbar and grid-line geometry, so defects are localized and graded per cell before being rolled up to a module verdict
- Severity grading rules: a deterministic rule layer converts the model’s pixel masks into a pass / minor / major / reject grade aligned with the client’s IEC 61215-based acceptance criteria, keeping the subjective ML output separate from the auditable grading logic
- Calibrated confidence: the model’s outputs are temperature-calibrated so the confidence score is meaningful, which lets the system route only genuinely uncertain modules to human review
- ONNX export: the trained PyTorch model is exported to ONNX and quantized, cutting inference latency roughly in half and letting it run on modest edge hardware without a GPU
Edge Inference
Factory chambers can’t depend on reliable internet, and inspectors need an instant verdict. We packaged the model as a containerized FastAPI service running on Azure IoT Edge on a small fanless box wired directly to the EL camera station. The moment an image is captured it’s scored locally:
- The raw EL capture is normalized and segmented into cells
- The ONNX model produces defect masks for every cell
- The rule layer computes a per-module severity grade
- The verdict, masks, and confidence are written to a local store and displayed to the inspector in under two seconds
- Results sync to the cloud opportunistically when connectivity is available, with a local buffer ensuring nothing is lost during outages
Borderline modules, those whose confidence falls in a configurable uncertainty band, are flagged for inspector adjudication rather than auto-graded, so a human stays in the loop exactly where it matters and nowhere it doesn’t.
Cloud Platform & Continuous Learning
Synced results land in a PostgreSQL-backed platform with a React review interface. Quality directors get defect-rate dashboards broken down by production line, shift, defect type, and module batch, turning EL inspection from a per-module gate into a live process-monitoring signal. A sustained uptick in finger interruptions on one line, for example, points straight at a stringer machine that needs servicing.
Every inspector adjudication of a borderline case is captured as a fresh, high-value label. These feed a periodic retraining loop: the model is re-evaluated against the held-out consensus benchmark before any new version is promoted, and rollout is staged line-by-line so a regression can never reach the whole fleet at once.
Results
The defect-detection system changed both the economics and the reliability of EL inspection:
- Per-module grading dropped from roughly a minute of manual review to 1.8 seconds of automated inference, letting a single station clear a full production shift instead of a sample
- The model catches 99.1% of true defects on the held-out benchmark, comfortably beyond the consistency of manual grading, while keeping false-reject rates low enough to avoid scrapping good modules
- Missed-defect escapes to the field fell 87% in the first year, directly reducing warranty exposure and the firm’s certification liability
- Inspectors shifted from grading every image to adjudicating only the small fraction the model flagged as uncertain, reclaiming the majority of their time for higher-value inspection work
- The platform now processes over 2 million EL images per year across the client’s factories, and defect-rate dashboards let quality directors catch a drifting production line in real time rather than discovering a bad batch after it ships